Real Estate Transactions in Saudi Arabia Reach SAR 23.7 Billion in June 2026
Real estate transactions in the Saudi market rose by 8% in June 2026 to approximately SAR 23.7 billion, up from SAR 22 billion in the same month of 2025. This growth was driven by a 24% increase in non-residential transaction values, while residential transaction values remained stable at SAR 15 billion, according to data from the Real Estate General Authority. Three administrative regions accounted for 75% of the total transaction value.
Real estate transaction values reached SAR 23.7 billion in June 2026, with three regions accounting for 75% of the total.
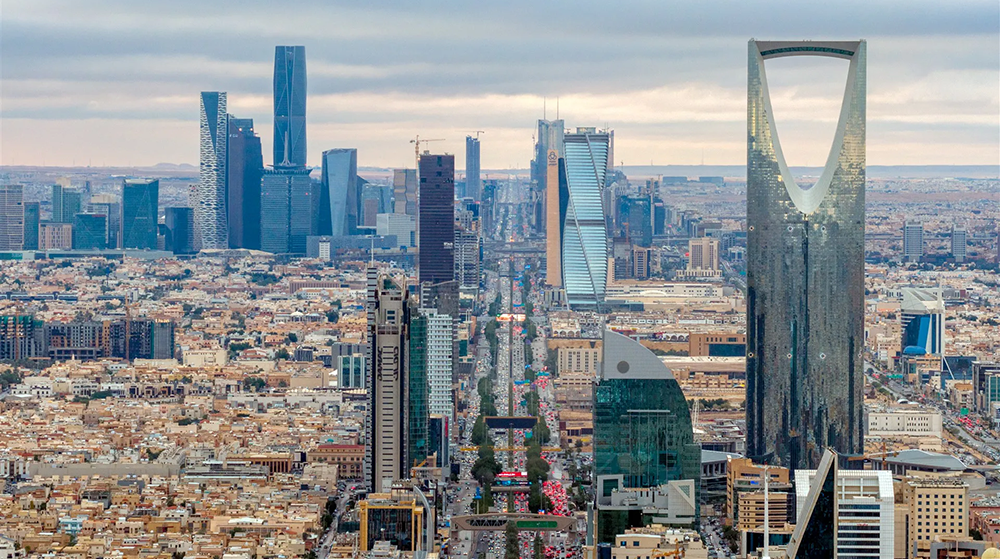
Riyadh City.
The value of real estate transactions in the Saudi market rose by 8% in June 2026 to approximately SAR 23.7 billion, compared to about SAR 22 billion during the same month in 2025.
This was driven by a 24% increase in the value of non-residential transactions to SAR 8.7 billion, compared to approximately SAR 7 billion in June 2025, while the value of residential transactions remained stable at about SAR 15 billion, according to data from the Real Estate General Authority.
Residential transactions accounted for about 63.5% of the total value of real estate transactions in June 2026, while non-residential transactions accounted for approximately 36.5%.
Real Estate Transaction Value by Sector (SAR Billion).
Sector, June 2025, June 2026, Change, Percentage of Total.
Residential, 15.02, 15.02, 63.5%, Non-Residential, 6.97, 8.65, +24%, 36.5%, Total, 21.99, 23.67, +8%, 100.0%.
Evolution of Real Estate Transactions by Sector (SAR Billion).
Month*, Residential, Non-Residential, Total, January 2026, 17.52, 10.96, 28.48, February, 14.65, 9.39, 24.04, March, 12.03, 7.34, 19.37, April, 18.07, 11.24, 29.31, May, 14.14, 8.47, 22.61, June, 15.02, 8.65, 23.67.
*Data is updated periodically.
The number of real estate transactions executed in June 2026 reached approximately 22,000, an increase of 18%. This rise was observed in both the residential and non-residential sectors, with growth rates of 18% and 21%, respectively.
Number of Real Estate Transactions by Sector.
Sector, June 2025, June 2026, Change.
Residential, 16866, 19844, +18%, Non-Residential, 1766, 2130, +21%, Total, 18632, 21974, +18%.
Land acquisitions accounted for the largest share of residential transaction value in June 2026, totaling SAR 7.3 billion, equivalent to about 49% of the total residential transaction value, followed by apartments at SAR 2.8 billion, and villas at SAR 2.3 billion.
The value of residential transactions varied across different property types during the period compared to the previous year, with houses recording the highest increase in value at 46%.
Residential Transaction Value by Property Type (SAR Billion).
Type, June 2025, June 2026, Change.
Land, 6.98, 7.29, +4%, Apartment, 3.21, 2.82, (12%), Villa, 2.35, 2.28, (3%), Duplex, 0.69, 0.81, +17%, House, 0.45, 0.66, +46%, Other, 1.34, 1.16, (14%), Total, 15.02, 15.02.
Data showed an almost universal increase in the number of residential real estate transactions across all property types in June 2026 compared to the same period the previous year, with the exception of apartments, which saw a slight decline of about 1%.
Number of Residential Transactions by Property Type.
Type, June 2025, June 2026, Change.
Land, 9674, 11175, +16%, Apartment, 4540, 4499, (1%), Villa, 1307, 1793, +37%, House, 508, 772, +52%, Duplex, 585, 719, +23%, Other, 252, 886, +252%, Total, 16866, 19844, +18%.
According to the data, real estate liquidity was concentrated in major regions; Riyadh accounted for 34% of the total transaction value, followed by Makkah at 27%, and the Eastern Province at 14%, with these three regions controlling 75% of the total real estate transaction value.
Top Administrative Regions by Real Estate Transaction Value.
Region, Value (SAR Billion), Share.
Riyadh, 8.04, 34%, Makkah, 6.45, 27%, Eastern Province, 3.2, 14%, Asir, 2.75, 12%, Madinah, 1.12, 5%.
The Riyadh region led real estate market activity in terms of transaction volume, accounting for 25% of the total number of transactions executed in the Kingdom, followed by Makkah at 22%, and the Eastern Province at 16%.
Top Administrative Regions by Number of Real Estate Transactions.
Region, Number of Transactions, Share.
Riyadh, 5437, 25%, Makkah, 4870, 22%, Eastern Province, 3504, 16%, Qassim, 1829, 8%, Asir, 1389, 6%.
Rental transaction values rose by 46% to SAR 8.8 billion, driven by an increase in non-residential leasing.
The value of rental transactions increased by 46% year-on-year to reach SAR 8.8 billion during June 2026, compared to about SAR 6.1 billion during the same month of the previous year.
This was the result of a 150% increase in the value of non-residential rental transactions to about SAR 6 billion, compared to SAR 2.4 billion in June 2025, accounting for about 68% of the total rental transaction value.
Rental Transaction Value by Sector (SAR Billion).
Sector, June 2025, June 2026, Change.
Residential, 3.68, 2.86, (22%), Non-Residential, 2.38, 5.97, +150%, Total, 6.06, 8.83, +46%.
The number of rental transactions also rose to 389,400 during June 2026, compared to approximately 268,600 during the same period of the previous year, recording an annual growth of 45%.
This increase was distributed between the residential sector, which grew by 38%, and the non-residential sector, which grew by 72%.
Number of Rental Transactions by Sector.
Sector, June 2025, June 2026, Change.
Residential, 211588, 291401, +38%, Non-Residential, 57024, 97959, +72%, Total, 268612, 389360, +45%.
The number of rental contracts in the Kingdom increased by 48% year-on-year in June 2026 to reach 330,400 contracts, supported by an increase in both residential and non-residential contracts.
Residential rental contracts recorded a growth of 42% to reach 261,400 contracts, while the number of non-residential rental contracts rose by 75% to reach 69,000 contracts.
Number of Rental Contracts by Sector.
Sector, June 2025, June 2026, Change.
Residential, 183964, 261363, +42%, Non-Residential, 39522, 68995, +75%, Total, 223486, 330358, +48%.
Riyadh led the administrative regions in terms of rental transaction value with SAR 3.8 billion, followed by Makkah with SAR 2.5 billion.
Top Administrative Regions by Rental Transaction Value.
Region, Value (SAR Billion), Share.
Riyadh, 3.79, 43%, Makkah, 2.51, 28%, Eastern Province, 1.1, 13%, Madinah, 0.5, 6%, Asir, 0.24, 3%.
The Riyadh region led the administrative regions in terms of the number of rental transactions, recording 127,800 transactions, representing 33% of the total transactions in the Kingdom.
The Makkah region ranked second with 104,800 transactions, with a share of 27%, followed by the Eastern Province with 61,400 transactions, representing 16%.
Top Administrative Regions by Number of Rental Transactions.
Region, Transactions, Share.
Riyadh, 127804, 33%, Makkah, 104767, 27%, Eastern Province, 61397, 16%, Madinah, 24309, 6%, Asir, 17595, 5%.
Original source: Argaam





Comments (0)
Be the first to comment.