Eastern Pipes Stock Hits Highest Price Since Listing
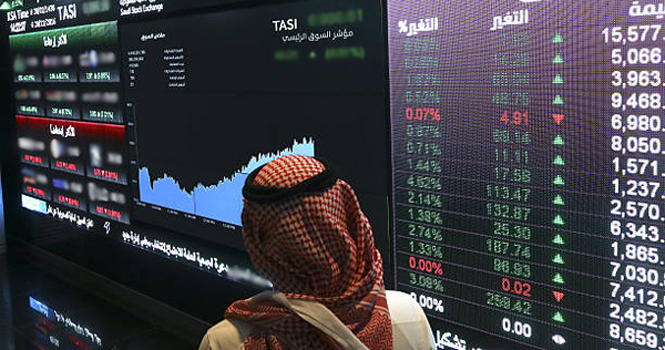
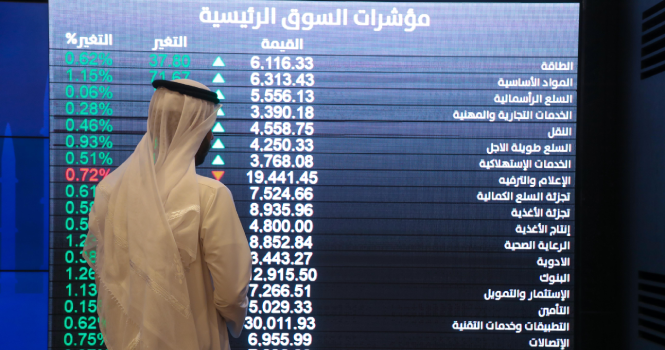
Eastern Pipes Integrated Industrial Company's stock, listed under the Basic Materials sector on the main market (TASI), recorded its highest price since listing at SAR 231.10 during Thursday's session.
The stock is trading 2% higher, with trading volume reaching about 186.24 thousand shares so far.
Annual high (SAR) Annual low (SAR) 231.10 102.90 High since listing (SAR) Low since listing (SAR) 231.10 36.50 Created with Highstock 6.0.710:3011:0011:3012:0012:3013:0013:3014:0014:3015:00223.00224.00225.00226.00227.00228.00229.00230.00231.00232.00Close: 227.00 | Jul 9, 15:19
With this rise, the stock's gains since the beginning of this year reach about 67%.
Stock Performance:
Open 226.20 Low 223.90 High 231.10 Previous Close 223.70 Change (3 months) 28.98% Change (6 months) 68.90% Market Cap 7,150.50 M. Volume (3 months) 282,228.12 M. Value Traded (3 months) 56,629,480.12 M. Number of Transactions (3 months) 3,423.87 Change (12 months) 82.18% Change from Year Start 64.14% The company made one capital adjustment in 2022 through a bonus share distribution.
Capital Adjustments (Million SAR):
Rate of Change Capital (Million SAR) Type Date 50.00% 315.00 Bonus 2022 0.00% 210.00 Initial Public Offering 2022 Financial Performance:
About the Company:
Eastern Pipes Integrated Industrial Company was founded in 2010 in Dammam as a limited liability company with a capital of SAR 500,000, operating under the name Pipe Development Company for Pipe Production. In the same year, it changed its name to Wellsop Middle East Pipes Company. Ten years later, the company merged with Wellsop Pipe Coating Company, then converted into a closed Saudi joint stock company and changed its name to Eastern Pipes Integrated Industrial Company. It then converted into a public Saudi joint stock company in 2022. The company's operations include...
How do you view the stock's trend? How do you view the stock's trend?
Financial Indicators:
Financial Ratio Current Market Cap (Million SAR) 7,150.51 Number of Shares (Million) 31.50 Recurring EPS (SAR) (Last 12 months) 18.20 Book Value (SAR) (Last announced period) 49.65 P/E Ratio (Recurring, Last 12 months) 12.47 Price/Book Value 4.57 Dividend Yield (%) (Last Year) 2.64 Return on Average Assets (%) (Last 12 months) 31.77 Return on Average Equity (%) (Last 12 months) 42.49 Par Value (SAR) 10.00 Enterprise Value (Million SAR) 6,469.56 EV/EBITDA 10.11 EV/EBIT 9.67 EV/Revenue 2.82 Calendar:
July 27 General Assembly -
Original source: Argaam

Comments (0)
Be the first to comment.