The False Rebound Dilemma: How Traders Fall into the Trap of Falling Stocks?
The False Rebound Dilemma: How Traders Fall into the Trap of Falling Stocks?
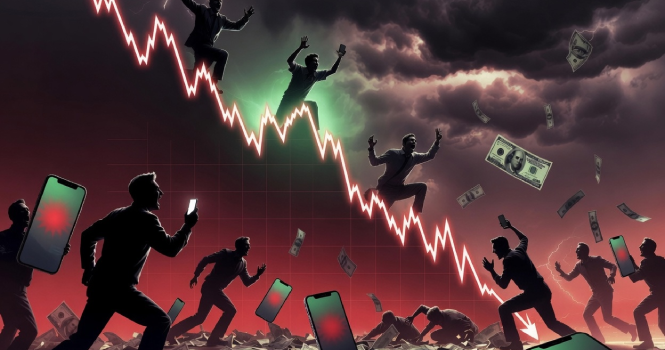
The false rebound phenomenon, also known as a dead cat bounce or bear trap, is one of the most psychologically enticing and financially destructive occurrences.
It happens when a stock loses 60% of its value over several months, then suddenly jumps about 20% within a few days amid flashy headlines predicting the end of the decline and the return of buyers.
This situation drives thousands of investors to rush and buy the stock for fear of missing a recovery opportunity, but often this rise is only temporary, as the stock resumes its decline, catching a new wave of investors in losses.
With the spread of free trading apps, social media platforms, and real-time market commentary, investors now react quickly to price movements, while interest in the more important question—has the company's performance actually improved?—declines.
The Cheap Stock Illusion
Behavioral finance studies indicate that investors tend to compare a stock’s current price to its previous price, rather than to the company’s true value.
If a stock was trading at $300 and then dropped to $120, many believe it has become 'cheap,' even if the company’s profits have fallen significantly.
Research on investment behavior shows that investors use historical prices as a reference point when making decisions, instead of reassessing the company’s future.
Prospect theory, developed by Daniel Kahneman and Amos Tversky, also explains why investors’ appetite for risk increases after losses; their primary goal becomes to recoup what they lost, driving them to buy falling stocks before any real signs of recovery appear.
Fund managers see a fundamental difference between buying a stock because its price fell and buying it because the company’s business has improved.
When Famous Companies Become the Biggest Traps
False rebounds are not limited to small companies; they also involve well-known global names.
For example, Peloton Interactive was one of the biggest beneficiaries of the COVID-19 pandemic, with its stock jumping to a record high of about $171 in January 2021, pushing its market value to over $50 billion.
But as life returned to normal, subscriber growth slowed, inventories rose, and profitability declined, sending the stock into a sharp downtrend.
During 2022 and 2023, the stock recorded several rebounds exceeding 10% in a single session, and even jumped more than 30% in some periods.
The rise followed news about restructuring plans and spreading speculation about a potential acquisition of the company, leading many investors to believe that the recovery had already begun.
However, these gains did not last, as the stock continued its decline to below $3 in 2024, a loss of over 98% from its historic peak.
The collapse of energy giant Enron in 2001 is another example in this regard. As the systematic fraud in the company’s accounts unraveled, the stock fell from its peak near $90 per share.
However, the decline was not continuous; it was punctuated by rebounds. When the stock later fell to $15, a number of investors decided to buy back in, pushing the stock to around $22, as financial commentators considered this rise evidence that the company was too big to fail.
Within weeks, that temporary momentum evaporated, and the stock eventually crumbled to zero, wiping out the wealth of late buyers.
Mechanisms of the False Rebound
A false rebound does not usually occur due to an improvement in the company’s situation, but rather as a result of technical and temporary market factors.
One of the most prominent factors is short covering, where investors who bet on the stock’s decline are forced to buy it back to lock in profits or limit losses, leading to increased demand and a short-lived price rise, even without any change in the company’s performance.
Automated trading systems and quantitative investment funds also contribute to this movement; many of these systems rely on technical signals such as breaking resistance levels or moving averages, and begin executing buy orders automatically, which amplifies the rise.
Data from the U.S. Securities and Exchange Commission indicates that electronic and algorithmic trading now accounts for the majority of transactions, while market research firms estimate that such trades make up between 60% and 70% of total trading in U.S. markets.
At the same time, news plays an important role in fueling this rise. An announcement of a change in executive management, or news of a potential acquisition, can trigger a temporary wave of optimism that pushes investors to buy before any actual improvement in revenue or profits appears.
For this reason, market analysts emphasize that a price rise alone is not enough to judge a company’s recovery, because markets can respond quickly to news and expectations, while improvements in business and financial results take several quarters to become clearly visible.
Social Media Contributes to the False Rebound
Free trading platforms and social media have changed the way individual investors interact with falling stocks. Instead of viewing a sharp decline as a signal requiring further analysis, many traders now consider it an automatic buying opportunity.
Phrases like 'buy the dip' and 'the stock is at a big discount' have spread whenever a well-known company suffers heavy losses.
Although buying strong companies during corrections has historically been a successful investment strategy, applying the same idea to all declining stocks has created a misleading perception among many investors.
In a study by economists Brad Barber and Terrance Odean, published in the Review of Financial Studies, they found that individual investors tend to buy stocks that capture market attention, whether due to news or sharp price volatility.
This pattern was clearly evident in the GameStop stock during the historic speculative wave in early 2021.
The stock rose from about $17.25 on the first trading day of 2021 to $347.51 at the close on January 27, gaining over 1900% in less than a month, and touched $483 during intraday trading the following day before a stock split.
But after the intense buying wave ended, the stock quickly collapsed, falling to around $53.50 by February 4, 2021, just six sessions after hitting the peak, before experiencing a series of rebounds exceeding 10% on many occasions over the following years.
Despite these repeated rises, a large part of the trading was driven by investor enthusiasm on social media platforms rather than an improvement in the company’s operational performance, and each uptick revived expectations of a return to previous highs.
The Investor’s Compass: Between True Recovery and False Rebound
Fund managers believe that the best way to distinguish between a true recovery and a false rebound is to focus on the company’s performance, not on the stock’s price movement.
Original source: Argaam



Comments (0)
Be the first to comment.